Clark County Heat Mapping Campaign

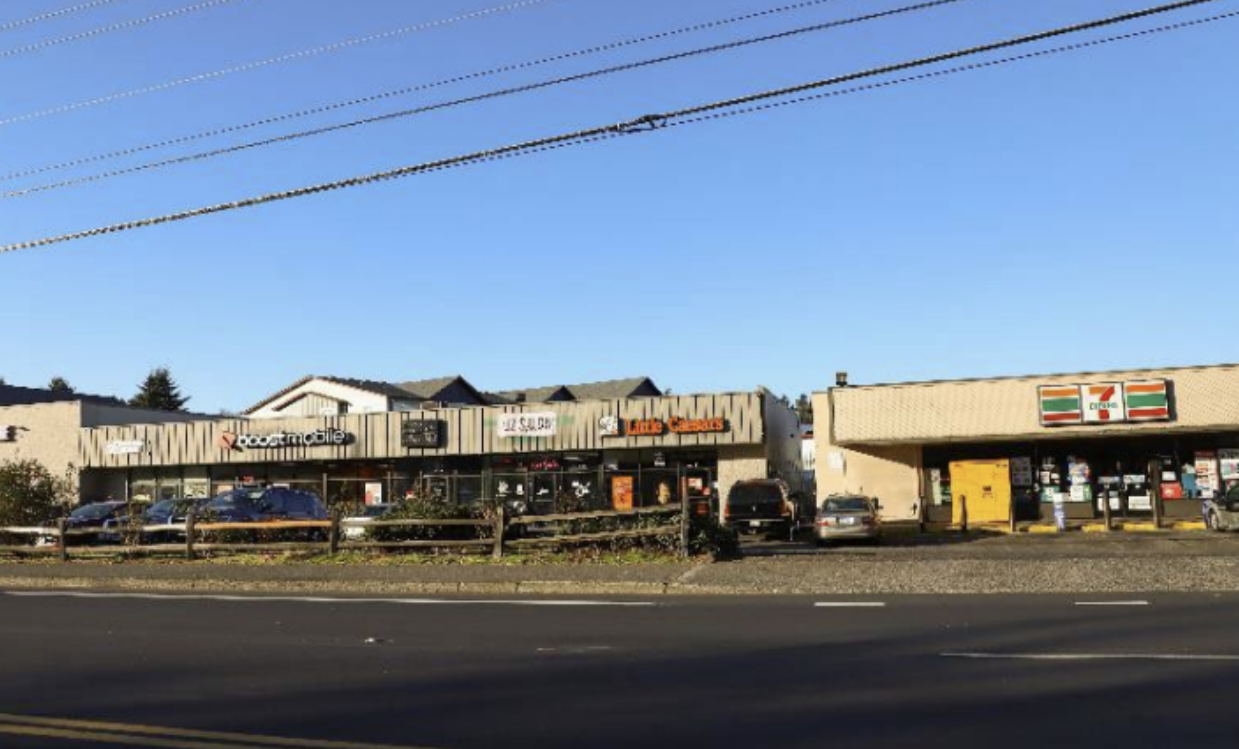
Photo example of urban heat island effect in the county from Public Health
Last month, a presentation was given to the Clark County Council (serving as the Clark County Board of Health) by Clark County Public Health about the Clark County Heat Watch Project as part of Public Health’s Climate Action Program. Did you know that existed in the county?!—because we didn’t! It was noted that this was a newer body of work for Public Health.
Background
The Heat Watch Project was born from the recognition of some basic facts:
- Extreme heat is the deadliest weather-related hazard nationally,
- Summers in Washington are getting longer and hotter, with heat waves becoming more frequent as a result of anthropogenic climate change;
- Clark County is getting hotter and extreme heat is becoming an increasing health threat;
- Heat and heat impacts to public health are not distributed equally.
Before sharing findings from the project, Public Health presented about the kinds of heat-related illness, which include: heat cramps, heat exhaustion, heat stroke, mental health impacts such as stress and anxiety, exacerbated existing mental health conditions, pregnancy complications, heart problems, and breathing problems. They also noted that emergency department visits from heat-related illnesses are increasing, and that visits were highest during the 2021 Heat Dome, where Vancouver reached 115 degrees Fahrenheit.
Public Health also explained the basics of the urban heat island effect to the councilors, which means that more developed areas are hotter than less-developed rural areas due to lack of green space and more paved surfaces. Green spaces absorb sunlight/heat, provide shade, and release water vapor into surrounding areas—but when paved over with asphalt, they absorb, retain, and re-emit heat. This effect can cause heat increases of over 8 degrees fahrenheit!
The Project
This project sought to map the varying heat distributions across the county in order to help with decision-making around heat impacts on public health. The project began with a community-driven temperature data collection event utilizing over 50 volunteers and covering almost 170 square miles across the county that was carried out last July.
You can check out the key takeaways from this data analysis and access the Heat Watch interactive map here.
Moving Data Toward Action
Clark County Public Health finished the presentation by giving a lesson on climate justice and health equity, calling for the need to address the unequal impacts of changes in climate by prioritizing those that will be most impacted.
According to Clark County Public Health, communities and populations most impacted by heat and other climate impacts include:
- Older adults
- Infants and children
- Pregnant people
- People with disabilities
- People with existing health conditions or who take certain medications
- Communities of color
- Tribal and Indigenous communities
- Refugees and recent immigrants
- People living unsheltered or unhoused
- People with low income
- People living in urban heat areas (areas in cities that are hotter than areas outside cities)
- People without access to air conditioning
- Outdoor workers
- People who exercise outdoors
The presenters advised that the county heat map be used to inform the development and implementation of cooling activities through land use, built environment, transportation, and community infrastructure policies and plans, long-term climate action strategies, and more.
Most importantly, the presentation concluded with the explicit statement by Public Health that the adoption of the Climate Element (including the policy recommendations from the Clark County Climate Community Advisory Group that are making their way through the approval process) with the Clark County Comp Plan update will help address many heat impact issues and would be a good first step in taking action.
The fact that this work is being done now is fabulous news! In this way, Clark County Public Health is getting a head start on the leg work necessary for the county to implement the Climate Element policies once the Clark County Comp Plan update is adopted.
Beyond Heat
Almost as important as the heat mapping project itself, though, is the broader recognition of the intersection between climate impacts and public health by Clark County.
For those who have long studied and advocated on climate issues, the connection may seem obvious. But many people today are disconnected from the natural world, unaware of the true environmental costs built into the products they use, and unfamiliar with where their food comes from or how it’s grown. This has led to a widespread lack of understanding about how the climate crisis will increasingly affect public health. No matter how much we shout, “It’s a climate emergency!” some folks just won’t get it until those lines are clearly drawn and links acknowledged on the local level.
This is why advocates have long expressed that climate impacts be a centerpiece of concern to public health departments, whether its impacts from heat waves, drought, other extreme weather events, food security, increases in vector-borne diseases, air and water quality—you name it—the collective health of our communities are at stake.
The work that Clark County Public Health is doing with the Climate Action Program is a welcome turning point and foundational for the work that’s to come.
Additional Resources: 62525 BOH Heat Mapping Campaign Presentation
